| Author |
Message |
ulf
Profi-Schrauber

Joined: 04/13/2002
Posts: 11058
Karma: +18 / -0 
Location: Saarland
2023 MG ZS
Premium Support
|
 15-06-2003, 19:27 Subject: 15-06-2003, 19:27 Subject: |
Quote |
|
Ernst S. wrote: | | Therefore, the air mass per hub must remain constant in order for it to remain a straight line. | Thus, there is nothing there that could, for example, indicate a deterioration in delivery rate.
Hi Ernst,
It's a bit easier to see in the original diagram... here are those two points from above again:
At 3000 rpm, the output is 292 kg/h. At 2000 rpm, the output is 208 kg/h.
Converted to individual doses , including washing loss :
0.867 grams at 2000 rpm, or 0.811 grams at 3000 rpm.
Assuming a constant charging pressure and speed-independent Quote: | cylinder scavenging losses, shouldn't the actual cylinder filling available for combustion have also deteriorated by 0.056 grams per stroke from 2000 to 3000 rpm??
| If the delivery rate were to worsen, then a decreasing curve would be created. However, in the diagram, there is simply a straight line that does not pass through the origin. The area between 1000 and 2000 has such a large slope because that's where the boost pressure and scavenging losses build up, I think. And not because the air mass per stroke is larger in that area.
Absolutely.
But in the second sentence: even with higher boost pressure, doesn't more air mass enter the cylinder per stroke?
What's the point of going through all the trouble of charging  ?   Gruß Ulf
_________
MG4 Electric
Translated on 29-08-2026, 20:28.
|
|
| Back to top |
Profile PM Garage |
 |
Ernst S.
Guest
Free account, no CAN development support
|
| 16-06-2003, 11:54 Subject: |
Quote |
|
It's a bit easier to see in the original diagram... here are those two points from above again:
At 3000 rpm, the output is 292 kg/h. At 2000 rpm, the output is 208 kg/h.
Converted to individual doses , including washing loss :
0.867 grams at 2000 rpm, or 0.811 grams at 3000 rpm.
Assuming a constant charging pressure and speed-independent cylinder scavenging losses, shouldn't the actual cylinder filling available for combustion have also deteriorated by 0.056 grams per stroke from 2000 to 3000 rpm??
No, that doesn't explain it yet: The scavenging losses are independent of the speed in terms of mass per hour. Therefore, for each stroke, the scavenging losses naturally become smaller.
(Mass flow rate per minute = Air per spindle * 2 * RPM + Flush volume)
The range of 1000-2000 has such a large increase because that's where the boost pressure and the scavenging losses build up, I think. And not because the air mass per stroke is larger in that range.
Absolutely.
But in the second sentence: even with higher boost pressure, doesn't more air mass enter the cylinder per stroke?
'This was in comparison to the slope above 2000 rpm. I claim that the air mass per stroke is directly proportional to the slope of the curve. However, this doesn't hold true in that range because the pressure buildup affects the curve. Otherwise, it's like that, and if the curve is a straight line (i.e., has a constant slope), then the air mass per stroke doesn't change. Instead, there can only be a speed-independent component (e.g., 40 kg/h of constant scavenging losses) in addition to that.'
If I express the line passing through the two values mentioned above mathematically, it is:
Air mass [kg/h] = 0.084 [kg/h/rpm] * speed [rpm] + 40 [kg/h]
You can enter the formula into Excel, and it will extend the straight line between 2000 and 3000 indefinitely. The value of 0.084 kg/h/rpm = 0.7 gr/stroke, which represents the cylinder filling mass and thus the delivery rate, remains constant. While the 40 kg of constant flushing losses reduce the air mass per revolution, this is only because less air was flushed during that revolution.
But, as I said, I don't believe those are straight lines; they must be curves, and that makes my calculation of the flushing losses invalid.
Best regards, Ernst.
Translated on 29-08-2026, 20:33.
|
|
| Back to top |
|
|
ulf
Profi-Schrauber
Joined: 04/13/2002
Posts: 11058
Karma: +18 / -0
Location: Saarland
2023 MG ZS
Premium Support
|
| 16-06-2003, 16:21 Subject: |
Quote |
|
Ernst S. wrote: | | The scavenging losses are independent of speed and are measured in the unit of mass per hour. Therefore, for each stroke, the scavenging losses naturally become smaller. | .
Hello Ernst,
Ah, so the story looks different again.
But to get back to the original question:
I was actually asking for a prediction of the mass flow rate at the charger as the speed increases (and as the boost pressure increases). And this mass flow rate is probably the same as what was referred to as the "air mass flow sensor" in the previous attachment - so the distinction between cylinder filling and scavenging losses isn't really necessary at this point.
Therefore, if the mass airflow sensor in the AFD shows a "slightly disproportionate" increase relative to the engine speed, following a simple straight line between 2000 and 3400 rpm, then, in my opinion, (almost) everything suggests that this line can be extended to approximately 4500 rpm without deviating significantly from reality.
The AFD (presumably referring to a specific device or system) has an air mass flow rate setpoint of 700 to 850 mg/pulse at 2500 rpm.
-> Average value = 775 mg. This translates to 232.5 kg of "net fill" per hour.
In the diagram, a value of 250 kg is indicated at 2500 rpm, and the difference likely represents the flushing losses, which increase the net value by 7.5% in this case.
Assuming a target value of 950 mg/stroke from AFN and similar companies, and also accounting for 7.5% for flushing losses (-> 1,025 mg), the "filling point" of the 81 kW engines, which is 1 gram at 3000 rpm, is already quite good on the diagram.
If one initially considers, in theory, an "industrial-grade" AFD (Abgasrückführung) system with a correspondingly increased boost pressure, one should, in my opinion, expect a simple parallel shift of the line representing the mass airflow sensor (Graph "81 kW TDI speculative"). 
Since the AFD engine has the same basic design as the 81 kW models, this result should also apply to the AFN and other similar engines... or am I making a significant error in my reasoning? Gruß Ulf
_________
MG4 Electric
Translated on 29-08-2026, 20:39.
|
|
| Back to top |
Profile PM Garage |
|
Ernst S.
Guest
Free account, no CAN development support
|
| 16-06-2003, 19:25 Subject: |
Quote |
|
The AFD (presumably referring to a specific device or system) has an air mass flow rate target of 700 to 850 mg/pulse at 2500 rpm.
-> Average value = 775 mg. This translates to 232.5 kg of 'net fill' per hour.
In the diagram, a value of 250 kg is indicated at 2500 rpm, and the difference likely represents the flushing losses, which increase the net value by 7.5% in this case.
Assuming a target value of 950 mg/stroke from AFN and similar companies, and also accounting for 7.5% for flushing losses (-> 1,025 mg), the 'filling point' of the 81 kW engines, which is 1 gram at 3000 rpm, is already quite good on the diagram.
Why add a 7.5% flush loss factor to the cylinder filling? The constant 17.5 kg/h of flush losses only results in 49 mg per cycle at 3000 rpm (which would be approximately 5% of 950 mg).
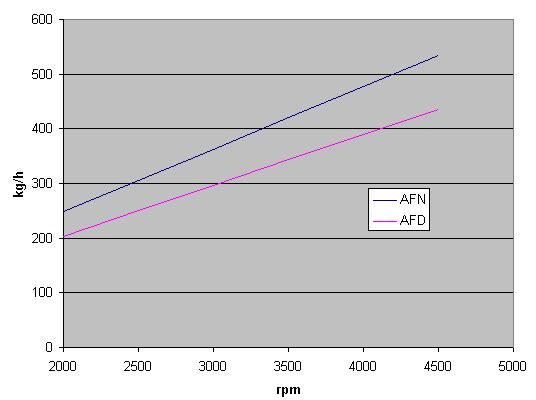
I'll create a diagram.
AFD: 775mg/dose cylinder filling and 17.5 kg/h purging losses.
AFN: 950mg/stroke and 21 kg/h fuel consumption due to the slightly higher boost pressure.
Two estimates of the air mass flow rate are obtained, neither of which accounts for a decreasing cylinder filling mass, which we would expect at higher speeds (due to volumetric efficiency).
The 'sink effect' determines the zero point of the two lines.
and the different cylinder filling masses determine the slopes of the lines.
Best regards, Ernst.
| Description: |
|
| File size: |
19.87 KB |
| Viewed: |
8896 times |
|
Translated on 29-08-2026, 20:43.
|
|
| Back to top |
|
|
ulf
Profi-Schrauber
Joined: 04/13/2002
Posts: 11058
Karma: +18 / -0
Location: Saarland
2023 MG ZS
Premium Support
|
| 16-06-2003, 20:53 Subject: |
Quote |
|
Ernst S. wrote: | | Why add 7.5% flush losses to the cylinder filling now? The constant 17.5 kg/h of flush losses only results in 49 mg per cycle at 3000 rpm (which would be approximately 5% of 950 mg) |
Hi Ernst,
OK, that was a mistake on my part. A constant rate of 17.5 kg/h is also OK  .
Quote: | I'll create a diagram.
AFD: 775mg/dose cylinder filling and 17.5 kg/h purging losses.
AFN: 950mg/stroke and 21 kg/h fuel consumption due to the slightly higher boost pressure.
Two estimations of the air mass flow emerge, without a decreasing cylinder filling mass, which we both expect at higher speeds (due to volumetric efficiency). |
"You're right. And if we were to adjust the AFD's performance graph based on the delivery rate, bringing it down to match the original graph's value (approximately 10 kg/h at 3400 rpm), and apply the same adjustment to the AFN, we could arrive at a well-informed estimate."
After that, the AFN draws approximately 450 kg/h of air at 4000 rpm and approximately 510 kg/h of air at 4500 rpm, which translates to 7.5 kg/min and 8.5 kg/min respectively, both at a boost pressure of 1 bar (P2C / P1C = 2.0).
If this information is entered into the load characteristic field of the initial post, both operating points will still be within the zone of >76% efficiency.
It would also be interesting to see the slope of a line that could be used to describe the relationship between mass flow and charging rate, starting from these points.
I believe it would run slightly flatter than the assumed central axis of the 76% "oval" and extend towards the upper right, exiting the map at a pressure ratio of approximately 2.3, which corresponds to a boost pressure of 1.3 bar.
That is to say, 1.3 bar at 4500 rpm should be the absolute maximum (without any remaining reserve ) that can be imposed on the VNT 15 turbocharger on a 1.9 TDI engine.
@all:
Does this calculation seem generally correct, or did I make a crucial mistake? Gruß Ulf
_________
MG4 Electric
Translated on 29-08-2026, 20:48.
|
|
| Back to top |
Profile PM Garage |
|
Ernst S.
Guest
Free account, no CAN development support
|
| 16-06-2003, 22:24 Subject: |
Quote |
|
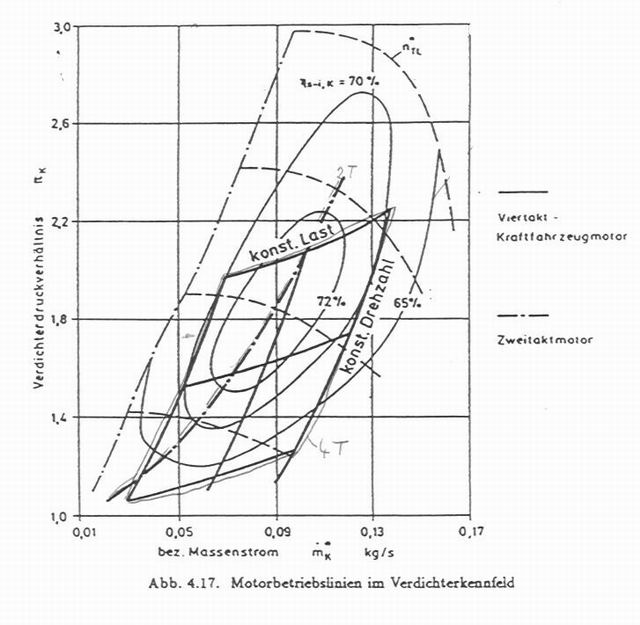
It would also be interesting to see the slope of a line that could be used to describe the relationship between mass flow and charging rate, starting from these points.
I believe it would run slightly flatter than the assumed central axis of the 76% 'oval' and would exit the characteristic curve at a pressure ratio of approximately 2.3, which corresponds to a boost pressure of 1.3 bar.
'Yes, it would look something like that. I've attached a sample image below. It shows how the motor's characteristic curve, defined by speed and load, would demand power from the compressor... but it's just a conceptual image and not a real one. So, don't be distracted by the curve shapes; who knows what kind of engine the designer had in mind.'
Best regards, Ernst.
| Description: |
|
| File size: |
50.57 KB |
| Viewed: |
10297 times |
|
Translated on 29-08-2026, 20:51.
|
|
| Back to top |
|
|
ulf
Profi-Schrauber
Joined: 04/13/2002
Posts: 11058
Karma: +18 / -0
Location: Saarland
2023 MG ZS
Premium Support
|
| 17-06-2003, 19:03 Subject: |
Quote |
|
Ernst S. wrote: | | Yes, it would look something like that. |
Hi Ernst,
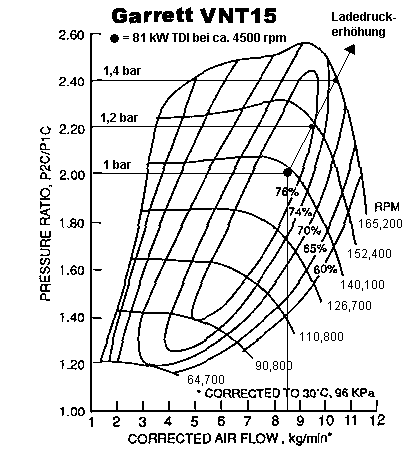
Since my assessment seems to be correct, I've added the operating point of an 81 kW TDI at 4500 rpm to the initial diagram, along with an approximate indication of the "trajectory" of that point with an increase in boost pressure.
At the normal rated speed of 4000 or 4150 rpm and normal boost pressure, the operating point would be approximately vertically above the point of 7.7 kg/min, also lying on the compression ratio line of 2.00, according to IMO.
Then, under normal pressure and 4500 rpm, the turbocharger reaches just under 140,000 rpm; at 1.2 bar, it reaches 152,000 rpm, and at 1.4 bar, it reaches 162,000 rpm, nearing the point of collapse with no margin for partially clogged air filters, overboost, etc. - if one interprets the outer edge of the performance curve in that way.
| Description: |
|
| File size: |
8.92 KB |
| Viewed: |
9317 times |
|
Gruß Ulf
_________
MG4 Electric
Translated on 29-08-2026, 20:53.
|
|
| Back to top |
Profile PM Garage |
|
Wolfgang, syncro16
Guest
Free account, no CAN development support
|
| 19-06-2003, 18:05 Subject: VNT15: Is It Oversized? |
Quote |
|
Hello Ulf,
Based on the results, I would now conclude that the VNT15 is probably too large for the AFN engine. If we consider the rated speed of 4150 RPM (why did you use 4500 RPM?), the point at 1 bar is still to the left of the efficiency maximum, and if you increase the boost pressure, the line will likely exceed the operating range somewhere around 1.5 bar. I'm not sure if that already indicates a problem, but even a factor of 1.5 seems oversized, especially since it's already close to the limit on the low end (or whatever that's called), for example, when running at 1500 RPM and 1 bar. I wouldn't be surprised if VW had to limit the boost pressure to protect the turbocharger.
Hello.
Wolfgang.
Translated on 29-08-2026, 20:56.
|
|
| Back to top |
|
|
ulf
Profi-Schrauber
Joined: 04/13/2002
Posts: 11058
Karma: +18 / -0
Location: Saarland
2023 MG ZS
Premium Support
|
| 19-06-2003, 22:04 Subject: VNT15: Is it oversized? |
Quote |
|
Wolfgang, syncro16 wrote: | | If we calculate based on the nominal speed of 4150 RPM (why did you use 4500?), then the point at 1 bar is still to the left of the efficiency maximum | .
Hi Wolfgang,
Calculating from an initial rate of 8.5 kg/min, and applying a ratio of 4150/4500, results in a rate of 7.83 kg/min. This value, at a pressure ratio of approximately 2.0, is located almost exactly in the middle of the inner "onion shell" region.
According to that, I find the VNT 15 practically perfect for the AFN  .
I expect that increasing the engine speed to around 4500 RPM will result in a slight increase in top speed, perhaps a few km/h.
Quote: | | especially since it gets quite tight on the far left side of the pressure boundary (or whatever it's called?), so when driving at 1500 RPM and 1 bar. I wouldn't be surprised if VW had to limit the boost pressure there to protect the turbo. |
Yes, my LDA also shows this: at speeds below 2000 rpm, the regulated pressure is usually limited to around 0.8 bar or even less. Gruß Ulf
_________
MG4 Electric
Translated on 29-08-2026, 20:58.
|
|
| Back to top |
Profile PM Garage |
|
|


 Bookmarks
 Links
Links Garage
 FAQ, Legal Notice & Privacy
 RSS Feed
 Register
 Login
Login
