| Author |
Message |
ulf
Profi-Schrauber

Joined: 04/13/2002
Posts: 11058
Karma: +18 / -0 
Location: Saarland
2023 MG ZS
Premium Support
|
 08-06-2003, 10:57 Subject: RPM, Boost & Air Mass: The Connection 08-06-2003, 10:57 Subject: RPM, Boost & Air Mass: The Connection |
Quote |
|
Hello.
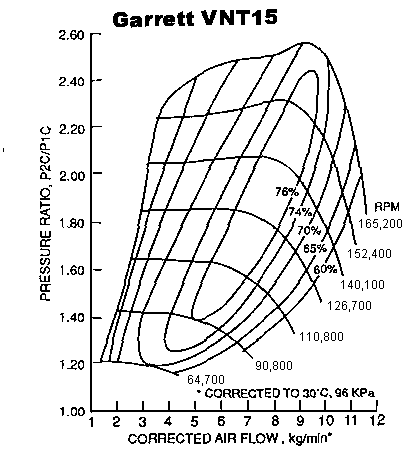
Based on a characteristic curve of the VNT 15 (as far as I understand it), I'd like to try and determine how much the boost pressure can be increased for a tuning modification without overloading the turbocharger.
Based on an optimal air mass of 1 gram per stroke, according to the AFN target value table, at 3000 rpm and 1 bar of boost pressure, I would like to know approximately how much air mass would still be able to enter the cylinders at, say, 4500 rpm, with the same boost pressure.
If the mass of air per revolution remained constant with increasing engine speed, the turbocharger would already be delivering 9 kg/min at 4500 engine RPM and an output/input pressure ratio of approximately 2.0 (which, in layman's terms, is 1 bar of boost pressure, i.e., without any pressure increase), and that would be at around 140,000 turbocharger RPM.
According to the loader's performance curve, the area where the loading efficiency drops significantly begins there.
If the boost pressure is increased by only 0.2 bar, the system will already be close to the limit of the turbocharger's performance curve at a turbocharger speed of 158,000 rpm (maximum speed according to the curve = 165,000 rpm). At this point, the turbocharger's efficiency has already dropped from approximately 76% to 71%.
In reality, as far as I know, cylinder filling gets worse with increasing engine speed – the question is, by how much.
If, at 4500 rpm and a certain boost pressure, only 0.9 grams of air per stroke were entering the cylinders, then, starting from 8.1 kg/min, a pressure increase of only 0.3 bar would be needed to reach the edge of the turbocharger's performance curve.
So: Are there simple rules by which one can estimate the volume loss with increasing speed and the same boost pressure? 
Does my assumption actually hold true that the mass airflow in the engine is proportional to the absolute boost pressure, or does the increasing intake air temperature then act as a brake ?
If so, by how much does the mass airflow lag behind an increase in boost pressure when the air-fuel ratio remains constant (rule of thumb)?
@Rainer
The attachment function is really great: you don't need a "Public Server" ( ), and even I was able to use it successfully right away - which means it's apparently idiot-proof  .
| Description: |
| RPM, Boost & Air Mass: The Connection |
|
| File size: |
8.08 KB |
| Viewed: |
15100 times |
|
Gruß Ulf
_________
MG4 Electric
Translated on 29-08-2026, 19:38.
|
|
| Back to top |
Profile PM Garage |
 |
christians
Profi-Schrauber
Joined: 09/05/2002
Posts: 2105
Karma: +17 / -0
Location: Sauerland
Premium Support
|
| 08-06-2003, 18:28 Subject: RPM, Boost & Air Mass: The Connection |
Quote |
|
ulf wrote: |
So: Are there simple rules by which one can estimate the volume loss with increasing speed and the same boost pressure? :?:
Does my assumption that the mass airflow in the engine is proportional to the absolute boost pressure actually hold true, or does the increasing intake air temperature then act as a brake :?:?
|
Hi, this acts as a brake: m2/m1 = (p2/p1)^(1/k). For air, k is approximately 1.4, so roughly m2 = m1 * (p2/p1)^0.7.
There probably isn't a simple rule because factors like valve overlap and resonance in the intake manifold play a role. Gruß Christian
A6 BPP, Ex-A6 AKN (Gurke), Ex-Audi100 92 AAT (5Zyl.)
Translated on 29-08-2026, 19:42.
|
|
| Back to top |
Profile PM |
|
ulf
Profi-Schrauber
Joined: 04/13/2002
Posts: 11058
Karma: +18 / -0
Location: Saarland
2023 MG ZS
Premium Support
|
| 09-06-2003, 9:06 Subject: RPM, Boost & Air Mass: The Connection |
Quote |
|
christians wrote: | Hi, it acts as a brake: m2/m1 = (p2/P1) ^ (1/k). k is approximately 1.4 for air, so roughly m2 = m1 * (p2/p1) ^ 0.7.
There probably isn't a simple rule because the valve overlap and the resonances in the intake manifold play a role. |
Hi Christian,
In your formula, do you mean 'm' represents mass and 'p' represents pressure, correct?
Then your answer only refers to the LL-Temp. question, and the margin for increasing boost pressure, according to the map, would have to be determined differently again.
However, in my opinion, the "reduction factor of 0.7" may not fully apply, as the temperature increase caused by pressure is partially offset by the cooling effect of the low-pressure coolant.
If you aim for the midpoint between your value of 0.7 and the "without temperature control" setting, you would end up in the area of...
m2 = m1 * (p2/p1)^0.85
Have I understood the calculation correctly?
- Incorrect without temperature correction: 2 -> 2.2 bar absolute = 1.1 times = 10% more air mass.
- with a correction of ^0.7 (without livestock) = 1.1 ^ 0.7 = 6.9% more air mass.
- with a correction of ^0.85 (estimated using LLK) = 1.1 ^ 0.85 = 8.4% more air mass
It just confused me that you included the (unanswered?) question about the speed in my quote. Gruß Ulf
_________
MG4 Electric
Translated on 29-08-2026, 19:45.
|
|
| Back to top |
Profile PM Garage |
|
Ernst S.
Guest
Free account, no CAN development support
|
| 09-06-2003, 13:15 Subject: Lossless? |
Quote |
|
Hello.
The formula also applies to an isentropic process, meaning a process without frictional heat. (Or, equivalently, a process where the heat lost due to friction is equal to the heat added by friction.)
Okay, so I would first calculate the isentropic temperature after the turbocharger, then use the efficiency to determine the actual temperature. Next, I would use the mass flow rate of the intake air and the mass flow rate through the intercooler to calculate the cooling of the intake air. Then, I would have a defined state from which I can calculate the density of the air and, consequently, the mass flow rate at each engine speed. ...pretty theoretical, I know.
Therefore: Ulf: Why don't you increase your boost pressure by the amount mentioned and measure the intake air temperature? (The same measurement conditions... so also the same driving speed for intake air cooling, etc. You'll figure that out yourself.)
That was all just about the boost pressure... I think I also have something about the RPM, but I need to find it first.
Best regards, Ernst.
Translated on 29-08-2026, 19:49.
|
|
| Back to top |
|
|
Ernst S.
Guest
Free account, no CAN development support
|
| 09-06-2003, 13:31 Subject: RPM, Boost & Air Mass: The Connection |
Quote |
|
Okay, I've got it.
'However, the attachment function isn't foolproof. How does it work? And more importantly, where is the button for it?'
'Or do I have to use the 'Img' tag again, and can I enter a local address?'
Best regards, Ernst.
Translated on 29-08-2026, 19:50.
|
|
| Back to top |
|
|
ulf
Profi-Schrauber
Joined: 04/13/2002
Posts: 11058
Karma: +18 / -0
Location: Saarland
2023 MG ZS
Premium Support
|
| 09-06-2003, 13:51 Subject: RPM, Boost & Air Mass: The Connection |
Quote |
|
Ernst S. wrote: | so I already have it.
"But the attachment function isn't foolproof. How does it work? And most importantly, where is the button for it?"
"Or do I have to use the 'Img' tag again, and can I enter a local address?"
Best regards, Ernst |
The button is located at the very bottom of the "Write" or "Quote" screen.
Then click "Browse" -> you can navigate through your computer to the desired file.
Submit and done. Gruß Ulf
_________
MG4 Electric
Translated on 29-08-2026, 19:51.
|
|
| Back to top |
Profile PM Garage |
|
Ernst S.
Guest
Free account, no CAN development support
|
| 09-06-2003, 14:22 Subject: RPM, Boost & Air Mass: The Connection |
Quote |
|
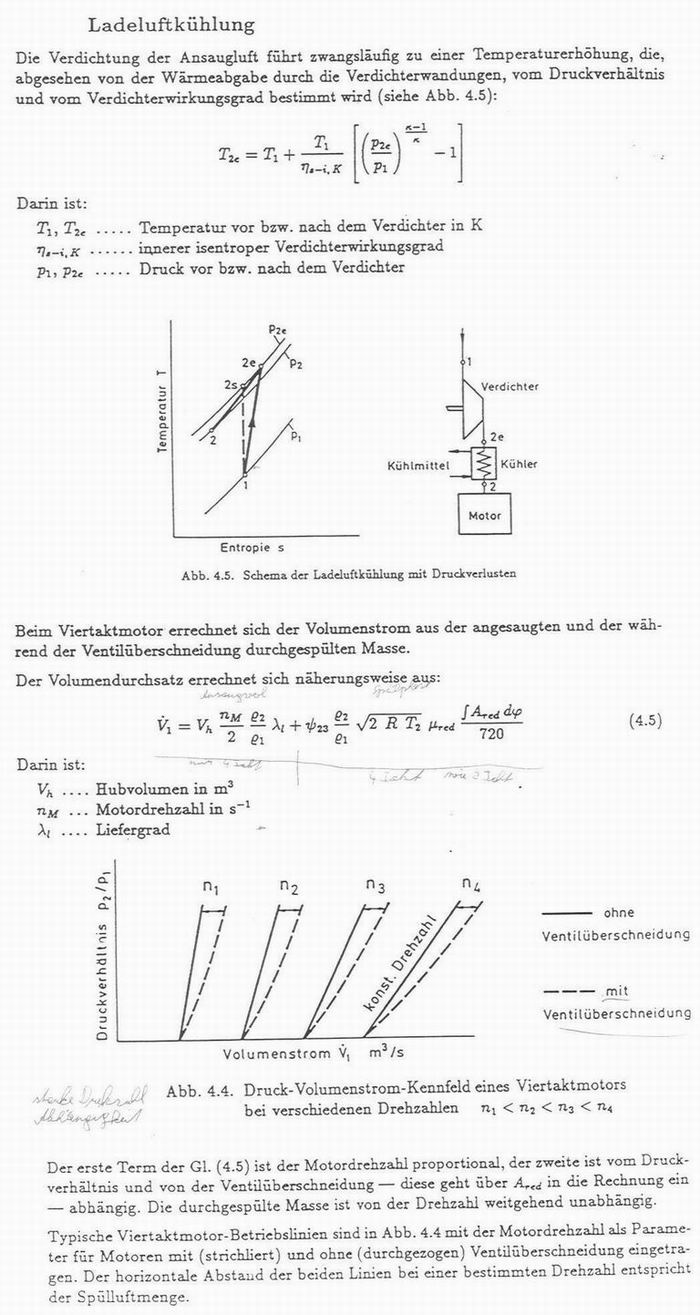
The temperature after the compressor is calculated as shown at the beginning of the attached image. Unfortunately, calculating the temperature after the intercooler is much more complicated (there is no predefined state change, not even isobaric), so I would prefer to measure it (but I don't have a VAGCom).
Calculate the density of the intake air from the temperature and then use this value in the formula for the volumetric flow rate. The main factor is the engine speed. The rest is more complicated. The symbol after the '+' is a function of the pressure ratio between the intake and exhaust. The integral represents the flow area during the overlap period.
To get a good approximation, you need to know a lot more. And to determine the true value, you need even more information (including the resonances, etc., that Christian mentioned).
Best regards,
Ernst
| Description: |
| RPM, Boost & Air Mass: The Connection |
|
| File size: |
130.32 KB |
| Viewed: |
5383 times |
|
Translated on 29-08-2026, 19:53.
|
|
| Back to top |
|
|
ulf
Profi-Schrauber
Joined: 04/13/2002
Posts: 11058
Karma: +18 / -0
Location: Saarland
2023 MG ZS
Premium Support
|
| 09-06-2003, 20:44 Subject: RPM, Boost & Air Mass: The Connection |
Quote |
|
Hi Ernst,
The lower diagram, in my opinion, does not perfectly and accurately show what I wanted to know  .
... namely, the dependence of the volumetric flow rate on the rotational speed, while keeping all other conditions constant.
Do you perhaps have a picture or a simple rule of thumb for that?
I only understand very small fractions of the volumetric flow formula, mainly because I haven't studied it  .
What do P1 and P2 refer to?
@Rainer:
Doesn't every forum member have access to the attachment function  ? Gruß Ulf
_________
MG4 Electric
Translated on 29-08-2026, 19:54.
|
|
| Back to top |
Profile PM Garage |
|
christians
Profi-Schrauber
Joined: 09/05/2002
Posts: 2105
Karma: +17 / -0
Location: Sauerland
Premium Support
|
| 09-06-2003, 21:54 Subject: RPM, Boost & Air Mass: The Connection |
Quote |
|
ulf wrote: |
Hi Christian,
In your formula, do you mean 'm' represents mass and 'p' represents pressure, correct?
|
Yes. I should have written that.
This, of course, only applies without intercooling and with a 100% efficiency of the compressor. It should only indicate the general direction of development. It is not easily possible to calculate how the intercooler deals with the additional heat.
Measurements taken from the vehicle being studied would be more helpful than theoretical considerations.
ulf wrote: |
It only confused me that you included the (unanswered?) question about the speed | in my quote.
Sorry, I wasn't feeling well.
However, Ernst's formula doesn't help either. I'm still missing a few variable definitions, but I think the formula calculates in a quasi-stationary manner. In practice, the pressure upstream of the valves isn't the average intake pressure, but rather a pressure caused by the oscillating air column in the intake manifold. This pressure can be higher than the design point, but it can also be lower. Gruß Christian
A6 BPP, Ex-A6 AKN (Gurke), Ex-Audi100 92 AAT (5Zyl.)
Translated on 29-08-2026, 19:56.
|
|
| Back to top |
Profile PM |
|
Ernst S.
Guest
Free account, no CAN development support
|
| 10-06-2003, 0:14 Subject: RPM, Boost & Air Mass: The Connection |
Quote |
|
Hi.
p1 is located before the compressor, and p2 is located before the intake valve, as can be seen in Figure 4.5.
In the volumetric flow formula, the values at these points are actually the air densities, denoted as ρ1 and ρ2 (in case you mistook those symbols for 'p').
From a purely conceptual point of view, the formula consists of:
Volume = Intake volume (mainly speed-dependent) + Scavenging volume (mainly pressure-dependent)
Sure, here is the translation of the text from German to English:
'For the first part:'
Displacement volume multiplied by rotational speed, divided by 2, multiplied by the density ratio (boost pressure to ambient pressure), multiplied by the volumetric efficiency.
That was also the most important thing.
So, your direct proportionality to the rotational speed is correct.
And it's directly proportional to the boost pressure (which is included in the density).
And then there's the division by the temperature of the intake air (which is also included in the density), which increases with a higher compression ratio (by how much? can only be measured).
To the second part, add what was added to the first part.
The amount of air that flows through during valve overlap depends on many factors, but not the engine speed.
I'm not sure if the 1mg/vial refers to the actual mass that ends up in the syringe, or if it includes the mass that is washed out. So, I don't know if you can use that value to calculate anything proportionally.
The differences caused by intake manifold vibrations can be compensated for by adjusting the delivery rate depending on the engine speed. (The average pressure before the valve remains unchanged. A ram-air effect occurs when a pressure wave reaches the cylinder just before the valve closes.) However, turbocharged engines are typically designed in a way that other charging effects are less significant, so there won't be much change. I fear the calculation will fail beforehand because there are so many influencing factors.
Best regards, Ernst.
Translated on 29-08-2026, 20:00.
|
|
| Back to top |
|
|
ulf
Profi-Schrauber
Joined: 04/13/2002
Posts: 11058
Karma: +18 / -0
Location: Saarland
2023 MG ZS
Premium Support
|
| 11-06-2003, 19:05 Subject: RPM, Boost & Air Mass: The Connection |
Quote |
|
Ernst S. wrote: | In terms of understanding, the formula consists of:
Volume = Intake volume (mainly speed-dependent) + Scavenging volume (mainly pressure-dependent)
Sure, here is the translation of the text from German to English:
"For the first part:"
Displacement volume multiplied by rotational speed, divided by 2, multiplied by the density ratio (boost pressure to ambient pressure), multiplied by the volumetric efficiency.
That was also the most important thing | .
Hi Ernst,
AFAIK, the volumetric efficiency (i.e., mass per intake stroke) generally decreases as the engine speed increases, regardless of intake manifold resonances and similar tricks. What would be the point of "aggressive" camshafts that improve performance in the higher RPM range?
Perhaps the delivery rate (what exactly is that?) is speed-dependent .
Quote: | | The volume of air that is flushed through during the valve overlap. This depends on many things, but not on the engine speed. |
The backflush losses can be ignored in this case, as I'm assuming a constant boost pressure during the increase in engine speed. Gruß Ulf
_________
MG4 Electric
Translated on 29-08-2026, 20:04.
|
|
| Back to top |
Profile PM Garage |
|
Ernst S.
Guest
Free account, no CAN development support
|
| 11-06-2003, 21:59 Subject: RPM, Boost & Air Mass: The Connection |
Quote |
|
Perhaps the delivery rate (what exactly is that?) is speed-dependent .
Yes, it is. It definitely states that in the script. I was just surprised myself.
And its definition is the ratio of the mass of air inside the cylinder after the intake valve closes to the mass of air that would occupy the same volume if it were at ambient conditions.
Okay, so the warming (e.g., due to cylinder walls) reduces the air mass and thus the delivery rate, as well as pressure drops caused by flow losses and the amount of residual gas.
AFAIK, the volumetric efficiency (i.e., mass per intake stroke) generally decreases with increasing engine speed, (excluding intake manifold resonances and similar tricks). } What would be the point of 'aggressive' camshafts that improve performance in the higher RPM range? }
I believe that intake manifold resonance can no longer be ignored in this case. Aggressive camshafts fundamentally extend the duration for which the valves are open. Furthermore, the camshafts determine how the intake manifold resonance interacts with the valve opening times. And the changing air velocities at different engine speeds are sometimes better utilized depending on the camshaft profile.
I think you're right, and it can be said that losses are greater at higher RPMs, and a camshaft adjustment is most beneficial in that range.
Best regards,
Ernst
Translated on 29-08-2026, 20:07.
|
|
| Back to top |
|
|
ulf
Profi-Schrauber
Joined: 04/13/2002
Posts: 11058
Karma: +18 / -0
Location: Saarland
2023 MG ZS
Premium Support
|
| 12-06-2003, 17:18 Subject: RPM, Boost & Air Mass: The Connection |
Quote |
|
Ernst S. wrote: | ulf wrote: |
Perhaps the delivery rate (what exactly is that?) is speed-dependent | .
Yes, it is. It definitely states that in the scriptum. I was just surprised myself. And its definition is the ratio of the air mass inside the cylinder after the intake valve closes to the air mass that would occupy the cylinder volume if it were at ambient conditions. |
Hi Ernst,
That is where we have the basic statement that I requested  .
Quote: | I hope that the mass flow meter now displays the value in grams, and that it includes the flushing losses... Then we could say that 1 - 0.85 = 0.15 grams are flushing losses, which at 3000 RPM would be 0.9 kg/min in flushing losses. And these flushing losses should remain relatively constant with the speed. At higher speeds, there is simply less time for flushing.
There is also less time for filling, which is probably why the delivery rate is worse at high speeds. |
Ursprünglich geht es mir ja um den Massenstrom durch den Lader, und der muß ja incl. SIt could be due to powder loss.
Nevertheless, the increase in this mass flow rate, as the rotational speed increases, will likely be somewhat limited by the deteriorating delivery rate.
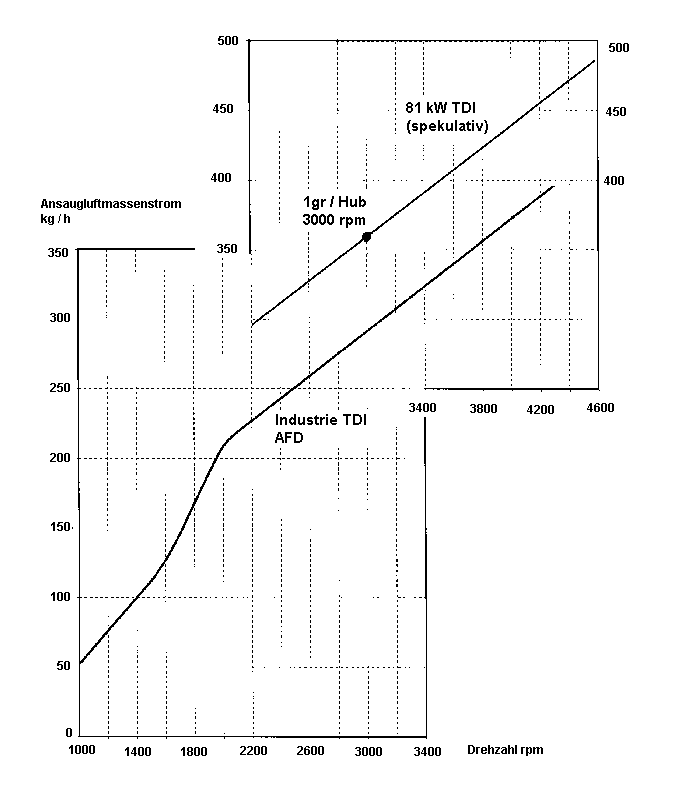
I actually found an interesting diagram about the mass airflow of the intake air. It's from an industrial TDI engine, but it has the same basic geometry as the "real" engines.
Subsequently, the mass flow rate increases "not quite proportionally" with the rotational speed: at 3000 rpm, it is "only" 1.40 times the value at 2000 rpm (292 vs. 208 kg/h).
Based solely on the speed, a 1.5 times higher mass flow rate would be expected. This means that the decreasing volumetric efficiency is apparently reducing the cylinder filling by approximately 7% per 1000 rpm (assuming the same boost pressure, although the documentation unfortunately doesn't provide any information about that). Gruß Ulf
_________
MG4 Electric
Translated on 29-08-2026, 20:12.
|
|
| Back to top |
Profile PM Garage |
|
Ernst S.
Guest
Free account, no CAN development support
|
| 12-06-2003, 18:16 Subject: RPM, Boost & Air Mass: The Connection |
Quote |
|
After that, the mass flow rate increases 'not quite proportionally' with the speed: at 3000 rpm, it is 'only' 1.40 times the value at 2000 rpm (292 vs. 208 kg/h).
Based solely on the speed, a 1.5 times higher mass flow rate would be expected, meaning that the decreasing delivery rate apparently reduces the cylinder filling by approximately 7% per 1000 rpm (assuming the same boost pressure, but unfortunately, the documentation doesn't provide any information about that).
One could also subtract an assumed 40 kg/h of rinsing losses from each value. Then, the ratio of cylinder filling rates, which depends on the speed, would be 252 / 168 = 1.5 !!!, and there would be no degradation in the delivery rate... but rather, only the speed-independent rinsing losses are distributed differently across the two mass flows.
In reality, the rinsing loss will be lower, and the deteriorating delivery rate will also contribute. I just wanted to show how the rinsing losses affect the overall process.
There are charge exchange simulation programs that could really help you. However, you need to input precise data, such as the geometry of the intake manifold and valve lift curves. And there's no simple formula because the design of the intake system can vary greatly.
Based on your specification of 1g/hub at 3000rpm, we can at least calculate the delivery rate in that specific scenario. (I deleted the calculation above; it was incorrect.)
Charge air density (2 bar, 313 K): 2.2541 kg/m³
Cylinder displacement volume: 0.000474 m³
Both multiplied together result in: 0.001068 kg = 1.068 g (the mass that theoretically fits per stroke in the cylinder).
You said that 1g per port is the actual mass of fresh gas located in the cylinder.
1 / 1.068 = 0.94 ... which corresponds to the definition of the delivery rate (relative to the condition before the inlet valve).
However, I cannot determine the further course of the delivery rate or the flushing losses. Perhaps you will achieve the desired overall reduction with the 7%/1000rpm, but that would be more of a matter of chance.
Best regards, Ernst.
Translated on 29-08-2026, 20:17.
|
|
| Back to top |
|
|
ulf
Profi-Schrauber
Joined: 04/13/2002
Posts: 11058
Karma: +18 / -0
Location: Saarland
2023 MG ZS
Premium Support
|
| 15-06-2003, 15:17 Subject: RPM, Boost & Air Mass: The Connection |
Quote |
|
Ernst S. wrote: | | However, I cannot determine the further course of the delivery rate or the flushing losses. Perhaps you will be able to achieve the 7%/1000rpm as a total uptake, but that would be more by chance. |
Hi Ernst,
The mass flow rate/speed graph is a simple straight line, so it's my opinion that one could "simulate" the behavior of the 81 kW engine by extending the graph to 4500 rpm and shifting it parallel to achieve a higher mass flow rate.
By the way, the origin diagram for the AFD only goes up to 3400 rpm / 350 kg/h.
As you can probably tell, I've modified the upper sections.
Do you think it's possible to "project" the conditions at the 81 kW level in this way, based on information from the AfD?
| Description: |
| RPM, Boost & Air Mass: The Connection |
|
| File size: |
10.02 KB |
| Viewed: |
9037 times |
|
Gruß Ulf
_________
MG4 Electric
Translated on 29-08-2026, 20:21.
|
|
| Back to top |
Profile PM Garage |
|
Ernst S.
Guest
Free account, no CAN development support
|
| 15-06-2003, 18:05 Subject: RPM, Boost & Air Mass: The Connection |
Quote |
|
Do you think it's conceivable that the conditions regarding the 81 kW can be 'projected' out of the AFD in this way?
Now that we're dealing with a straight line, we can infer more from it.
Range of 2000 - 3400 rpm (mathematically: ...).
'A straight line is defined by a constant slope. The slope, however, is nothing more than the air mass per unit volume (with a few dimensional conversions). Therefore, the air mass per unit volume must remain constant in order for the line to remain straight. Thus, there's nothing within the data that could indicate, for example, a degradation in delivery rate.'
If the delivery rate were to decrease, a decreasing curve would be created. However, the diagram shows a simple straight line that does not pass through the origin. The magnitude remains constant with increasing speed, which indicates flushing losses.
Now, one might simply extend the straight line down to 0 rpm (and first have to draw that 0 rpm point), and then say: 'These are the losses due to flushing.' However, that's not possible either because:
I don't think the diagram is very accurate... the three lines are just approximations. Between 2000 and 3400 RPM, the torque should remain relatively constant, so a straight line is sufficient. At higher RPMs, especially above the peak power, the torque will likely continue to decrease more gradually because the fuel delivery will start to degrade.
The area between 1000 and 2000 seems to have such a steep slope because that's where the boost pressure and scavenging losses likely build up, rather than because the air mass per stroke is larger.
Best regards, Ernst.
Translated on 29-08-2026, 20:24.
|
|
| Back to top |
|
|
|


 Bookmarks
 Links
Links Garage
 FAQ, Legal Notice & Privacy
 RSS Feed
 Register
 Login
Login
