| Author |
Message |
Jan6K
Joined: 04/12/2002
Posts: 4741
Karma: +107 / -0 
Location: Hagen
Premium Support
|
 08-07-2002, 10:41 Subject: ASV Acceleration Data: Measurements and Analysis 08-07-2002, 10:41 Subject: ASV Acceleration Data: Measurements and Analysis |
Quote |
|
Hi everyone,
Okay, I'm starting a new thread and posting this here. In the other thread about the DZR, there was interest in measurement data from a production machine, so here they are  .
Conditions: Approximately 22 degrees Celsius, climate control turned off during acceleration tests. The Ibiza has a stated curb weight of 1240 kg. With a nearly full tank and a driver weighing 60 kg, the total weight is likely around 1240 kg (assuming a heavier driver but less diesel). The engine was warm. The AGR (Acoustic Glide Retrofit) system is functional. The transmission is the same as in a Golf 3. Tires: 185/55/R15.
I used VAG-COM in logging mode and recorded data from blocks 6 (speed, pedal position, and throttle position), 3 (engine speed, air mass, EGR position), and 11 (engine speed, boost pressure, boost pressure regulation).
Unfortunately, this results in a very low sampling rate (less than 1 Hz), but since two of the blocks contain the rotational speed that is important to us (and the third contains the velocity), and everything is also timestamped, it should be sufficient for the calculations.
Since I was driving alone, I logged the entire trip. There's a second measurement for the warm-up phase, but I didn't perform a load test during that, and instead of logging 6 values, I logged 7, which are the temperatures (air, fuel, and coolant).
I don't want to overwhelm you with files that are 2x45 KB each, but for those who still want them:
http://www.informatik.hu-berlin.de/~richling/tmp/ - I will delete it in a few days.
The second run (....006...) includes the attempts to reach full power, while the other run is the warm-up run.
Here are only the relevant data, formatted as follows: Below are the three measurement blocks, with the timestamp (in seconds) at the beginning of each, followed by the measurement value. For the first block, it's only speed; for the other two blocks, it's RPM. This is for both measurements sequentially. If you also want to see boost pressure and EGR position (which can be interesting), please visit the website and download the CSV files.
Here are the values:
1. Sure, here is the translation of the text from German to English:
"Versuch" translates to "attempt" or "try" in English.
388.13 33
389.51 33
390.89 41
392.26 52
393.64 64
395.02 76
396.4 86
397.79 96
399.16 105
400.54 112
401.92 116
403.3 116
388.59 1281
389.97 1512
391.35 1911
392.73 2415
394.1 2877
395.48 3339
396.86 3738
398.25 4116
399.62 4431
401 4641
402.38 4767
403.76 4578
387.66 1344
389.05 1323
390.43 1638
391.81 2100
393.18 2562
394.56 3024
395.94 3465
397.32 3864
398.7 4221
400.08 4515
401.46 4683
402.84 4662
2. Sure, here is the translation of the text from German to English:
"Versuch" translates to "attempt" or "try" in English.
537.12 34
538.5 44
539.88 56
541.26 68
542.64 79
544.02 90
545.4 99
546.78 102
537.58 1596
538.96 2079
540.34 2562
541.72 3024
543.1 3465
544.48 3885
545.86 4242
547.24 4032
536.66 1344
538.04 1764
539.42 2247
540.8 2709
542.18 3171
543.56 3612
544.94 4011
546.32 4179
The timestamps here also make it easier to find the two attempts in the CSV files .
I haven't done any calculations or analysis myself yet, and I probably won't be able to do that until tonight. So, I'm just putting this out there as a starting point for discussion.
In my first attempt, I pulled it up to the beginning of the red zone. In the CSV files, you can clearly see how the boost pressure drops significantly towards the end. And... you can also see there when I hit the brakes (which was necessary... the attempt wasn't really legal in terms of maximum speed, etc.).
Best regards,
Jan.
Best regards,
Jan. 1Z5 CFHF  / AHB H4D 
Translated on 12-09-2026, 23:12.
|
|
| Back to top |
Profile PM |
 |
ulf
Profi-Schrauber

Joined: 04/13/2002
Posts: 11058
Karma: +18 / -0
Location: Saarland
2023 MG ZS
Premium Support
|
| 08-07-2002, 17:21 Subject: Data Feed Optimization: Improve Your Results |
Quote |
|
Hi Jan,
Well done... I'll try to figure out, at some point, how the torque curve of the DZR compares to the AFN. Gruß Ulf
_________
MG4 Electric
Translated on 12-09-2026, 23:21.
|
|
| Back to top |
Profile PM Garage |
|
Jan6K
Joined: 04/12/2002
Posts: 4741
Karma: +107 / -0
Location: Hagen
Premium Support
|
| 08-07-2002, 17:51 Subject: ASV Acceleration Data: Measurements and Analysis |
Quote |
|
Hi everyone,
And now, here are the two beautiful diagrams . I just sat down with Excel, Emacs, and Gnuplot, and extracted some data to plot the curves and calculate the results for at least the two 50->100 maneuvers. The results were 6.31 seconds in the first attempt and 6.18 seconds in the second attempt, both from 2000 RPM to 4000 RPM. According to the speedometer, the speed is approximately 50 to 100, while the data from the engine control unit (which also provides speed information) indicates 48-96, and Ulf's table shows 50.3-100.6. The latter, in my opinion, is closer to the truth; I believe the control unit is based on different tires (although these are still the original ones). For further questions about the car, please see above or simply ask.
I calculated the numbers based on the curves, which I plotted very simply using a ruler and pencil on a printout, and I verified the linearity of the printout.
Okay, and here are the details:
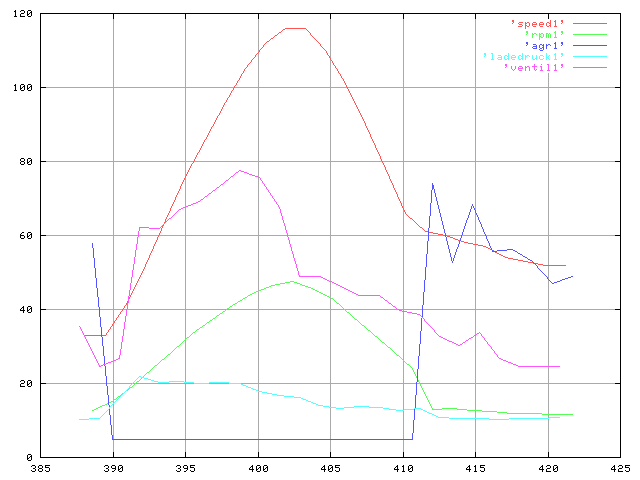 (URL change, Rainer K.)
and the second attempt:
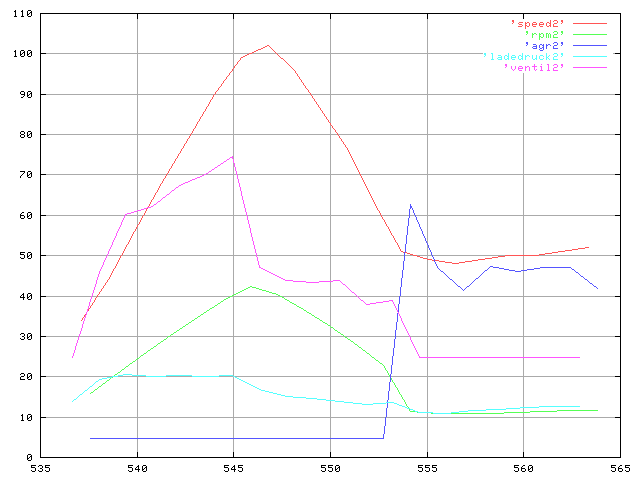 (URL change, Rainer K.)
Times, as mentioned above, according to my calculations, are 6.31 and 6.18 seconds. For those who want more precise measurements, please refer to...
http://www.informatik.hu-berlin.de/~richling/tmp/ are also the PostScript files for both diagrams.
Now, here's the explanation for the individual values:
Red is speed according to the engine control unit (see above).
"Green indicates the speed (divided by 100 for scaling)."
"blue is the duty cycle of the AGR valve in %"
"Zyan" represents the boost pressure, scaled by 100 and expressed as an absolute value. A value of 20, therefore, indicates 2000 mbar, which is equivalent to 1 bar after subtracting the atmospheric pressure.
"Violet" refers to the key ratio of the charge control valve, expressed as a percentage.
Both curves start at the point where I applied full throttle, and after braking, there's a slight "oscillation" around 50 km/h before settling down, which then happens in 5th gear. If you want to know more details, you can check the files above. The flags for the clutch and brake also show what I did in each case.
In the first attempt, I almost fully opened the throttle to the third gear (4700 RPM), while in the second attempt, I stopped shortly after exceeding 4000 RPM.
That's all from me, now you can analyze .
What I find interesting:
- You can clearly see how the AGR (Adjustable Gas Recirculation) completely retracts under full load.
- The relationship between the boost pressure control valve and the boost pressure; I'm not entirely sure what "100%" means here. I suspect that at 100%, the vanes are positioned in a way that results in the minimum pressure. What do you think?
Best regards,
Jan.
P.S.: Rainer: If you'd like to include the images, feel free to do so. I can also provide you with the raw data and my scripts if you want to use Gnuplot with different options.
Edit by Jan: Adjusted the names of the curve colors. Surprisingly, they were different in the expression compared to the graphic. Now, they match the graphic in the text as well, unlike before when they only matched my expression. 1Z5 CFHF / AHB H4D
Translated on 12-09-2026, 23:25.
|
|
| Back to top |
Profile PM |
|
dieselschrauber
Administrator

Joined: 04/12/2002
Posts: 18113
Karma: +800 / -0
Location: St.Gallen
2018 Volkswagen T6 
|
| 08-07-2002, 18:07 Subject: ASV Acceleration Data: Measurements and Analysis |
Quote |
|
Hello Jan!
Great that you did the measurements!
Unfortunately, I only know the name "Gnuplot," so I'll just include the two images .
The 100% control signal for the magnetic valve used for turbocharger pressure regulation indeed corresponds to the VTG (Variable Turbine Geometry) position of 'minimum boost pressure'. In practice, the duty cycle can be adjusted by the control unit up to approximately 95%.
Best regards, Rainer.
Translated on 12-09-2026, 23:30.
|
|
| Back to top |
Profile PM WWW Garage |
|
ulf
Profi-Schrauber
Joined: 04/13/2002
Posts: 11058
Karma: +18 / -0
Location: Saarland
2023 MG ZS
Premium Support
|
| 08-07-2002, 20:17 Subject: DZR vs. [Alternative]: Comparison & Analysis |
Quote |
|
Hi Jan,
Quote: | | Constraints: Approximately 22 degrees Celsius, climate control turned off during acceleration tests, Ibiza with the specified curb weight of 1240 kilograms, with a nearly full tank, and a driver weighing 60 kilograms - so it probably weighs around 1240 kilograms as well (because they assumed a heavier driver, but less diesel). The engine was warm. AGR (exhaust gas recirculation) is functioning correctly. The transmission is the same as in a Golf 3. Tires: 185/55/R15 |
According to the DZR calculation, with an acceleration time of approximately 6.2 to 6.3 seconds from 2000 to 4000 rpm, your Ibiza falls into the category of noticeably overpowered TDIs: my calculation suggests about 14% "too much" power, which translates to roughly 125 horsepower.
By the way, the percentage result is the same as for our ALH-Ibiza models...
I also spent some time "manually" interpolating data to try and understand the torque curve of your car, which might deviate significantly from the DZR (Dynamic Resonance Curve). In doing so, I used average values from your tests for the rate of increase in RPM in the ranges around 2000, 3000, and 4000 rpm.
Result --> Compared to the DZR (direct-drive zero-emission reactor) with a consistent 14% increase in torque, your "speed acceleration" values differ as follows:
At approximately 2000 rpm, your car is about 1.5% less powerful than the DZR.
At approximately 3000 rpm, your car is about 0.4% more powerful than the DZR.
At 4000 rpm, your car is approximately 0.2% less powerful than the DZR.
It is likely that the picture will not change fundamentally in the meantime.
In my opinion, that means...
- that the DZR (differential gear) can be quite accurately matched to the AFN (automatic friction neutralizer) torque curve and thus transferred to your ASV (automatic slip control).
- that the suspected/calculated additional power apparently does not concentrate in the lower speed range, but is "added" across the entire range between 2000 and 4000 rpm.
Another piece of the puzzle regarding the TDI horsepower...  Gruß Ulf
_________
MG4 Electric
Translated on 12-09-2026, 23:33.
|
|
| Back to top |
Profile PM Garage |
|
Jan6K
Joined: 04/12/2002
Posts: 4741
Karma: +107 / -0
Location: Hagen
Premium Support
|
| 08-07-2002, 21:30 Subject: ASV Acceleration Data: Measurements and Analysis |
Quote |
|
Hi Ulf,
"These variations, which can reach up to plus or minus 1.5%, are likely lost in the noise of inaccuracies. Otherwise, the results seem to confirm the previous manual measurements (both those I took alone and those I took with my girlfriend) – the values from back then are almost identical to the ones we're seeing now."
What I also find a little surprising about my results (I hadn't really expected it, and you only really see it when you have a curve right in front of you) is the almost linear increase in speed, or rather, the rotational speed, from 2000 to 4000 revolutions, especially in the second attempt. I would have thought that the non-linearly increasing resistance would cause a flatter curve... but you never stop learning from .
Well... let's see what else can be derived from my measurements... I've actually recorded much more data (e.g., air mass) - the filter is the standard paper filter .
Best regards,
Jan. 1Z5 CFHF / AHB H4D
Translated on 12-09-2026, 23:37.
|
|
| Back to top |
Profile PM |
|
|


 Bookmarks
 Links
Links Garage
 FAQ, Legal Notice & Privacy
 RSS Feed
 Register
 Login
Login
