| Author |
Message |
ulf
Profi-Schrauber

Joined: 04/13/2002
Posts: 11058
Karma: +18 / -0 
Location: Saarland
2023 MG ZS
Premium Support
|
 26-11-2004, 16:42 Subject: VAGCOM: Speedometer, Accelerator, and More |
Quote |
|
Hello,
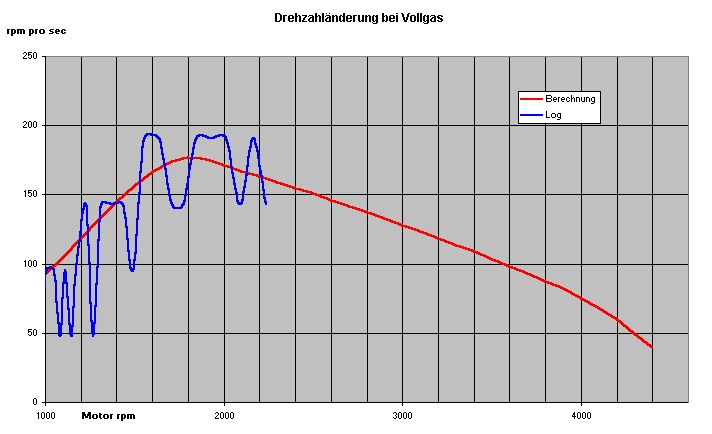
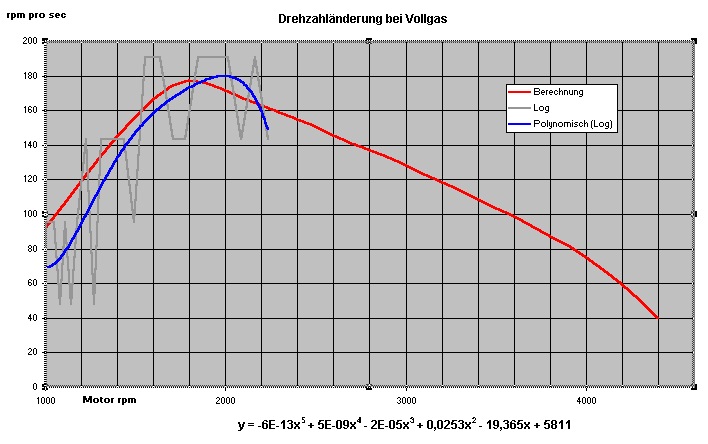
To investigate the actual PD (pressure drop) weakness at low engine speeds, I created a VAGCOM log while driving in 4th gear at full throttle, from approximately 1000 to 2200 rpm.
I then wanted to analyze the data based on the "acceleration rate" (expressed as rpm per second) and compare it with the DZR simulation.
Even with a sampling rate of approximately 2.3 Hz combined with the VAGCOM speed grid of 21 rpm, the resolution is likely "too coarse" to obtain a usable curve.
In the attachment, the red line represents the target curve according to the DZR standard, which is based on a "reliable" ASZ diagram.
Blue is the result of my calculation from the log.
The X-values are the average of two consecutive RPM log values, i.e., (RPM 1 + RPM 2) / 2. The Y-values represent the change in RPM per second, calculated from the time stamps and the difference in RPM between the same two log lines, i.e., (RPM 2 - RPM 1) / (Time 2 - Time 1).
With a little imagination, one can see that the acceleration at low RPM is actually worse than calculated, but I don't think it's possible to make more precise quantitative statements.
When looking at the result, it seems questionable to me whether reliable DZR times can be interpolated from VAGCOM logs  .
Perhaps our interpolator, Jan6K, could once again champion the digital age and possibly devise a calculation method that transforms the log data into a well-supported, "soft" curve?
| Description: |
| VAGCOM: Speedometer, Accelerator, and More |
|
| File size: |
61.84 KB |
| Viewed: |
2477 times |
|
Gruß Ulf
_________
MG4 Electric
Translated on 08-10-2026, 23:29.
|
|
| Back to top |
Profile PM Garage |
 |
Jan6K
Joined: 04/12/2002
Posts: 4741
Karma: +107 / -0
Location: Hagen
Premium Support
|
| 26-11-2004, 17:59 Subject: VAGCOM: Speedometer, Accelerator, and More |
Quote |
|
Hi,
I would say you don't have a chance here. The reason is that when you calculate the respective increases using the stepped measurement values, you end up capturing the full error of the steps twice in each interval (for both measurement values). This creates your grid-like curve.
In contrast, with the DRZ, you also had this error twice, but only in total, namely at the beginning and end. This results in an error of perhaps 0.1 seconds or less over an interval of 6+ seconds, so it's not that bad. Here, however, you have an error of 0.1 seconds over a time of less than 0.4 seconds – that can't work. To be precise, the errors are in the speeds, not the times, but I have examples to illustrate this...
The error can be easily calculated... simply assume rpm1+10 and rpm2-10 as the minimum slope for each interval, and rpm1-10 and rpm2+10 as the maximum slope. This will cause extreme scattering in the graph.
+-10 because we have a 21-point scale, and therefore, anything that is greater or smaller than 10 will fall within our range.
In short: Interpolation works at the DRZ if you are aware of the error it causes (simply calculate the possible combinations of RPM values with +/- 10), but this error is small compared to the time being measured. However, it doesn't work here because the error has an extreme influence on the calculated curve slope (which is clearly visible in the image, in my opinion).
It might be useful to interpret the graph as a "band" by calculating the maximum and minimum values of the increase for each measurement point (as described above) and then plotting these values as a band. I would expect that the pre-calculated curve would lie somewhere within this band.
Best regards,
Jan.
1Z5 CFHF  / AHB H4D 
Translated on 08-10-2026, 23:33.
|
|
| Back to top |
Profile PM |
|
ulf
Profi-Schrauber
Joined: 04/13/2002
Posts: 11058
Karma: +18 / -0
Location: Saarland
2023 MG ZS
Premium Support
|
| 26-11-2004, 18:18 Subject: VAGCOM: Speedometer, Accelerator, and More |
Quote |
|
Jan6K wrote: | | It might be useful to interpret the graph as a "band" by calculating the maximum and minimum values of the increase for each measurement point (as mentioned above) and then plotting this as a band. | I would expect that the pre-calculated curve would lie within that band. 
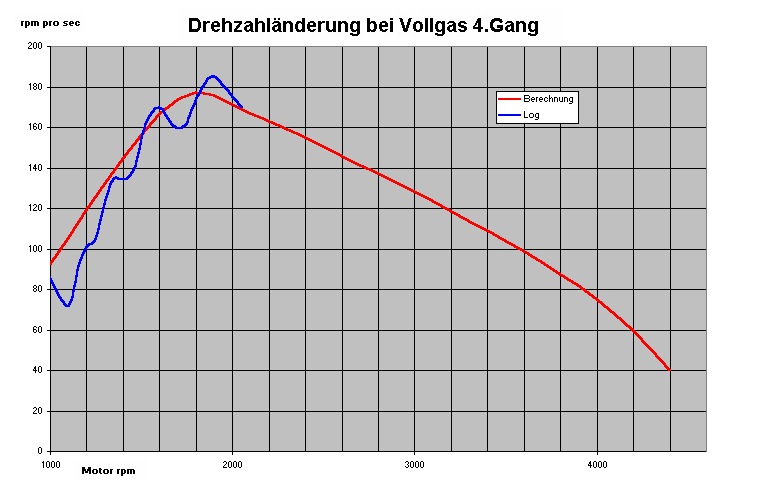
Hmm, I just realized that the midpoints of all the lines connecting the data points could potentially form a somewhat useful curve.
I'm not sure if we're talking about the same thing, but I'll try to calculate these "interpolated" points and plot them on the graph.
-> Excel will take care of it. 
EDIT:
I've done the whole thing three times in a row, but it still doesn't feel quite smooth }.
However, at least now we can better estimate that, starting at 1000 rpm, there is initially a deficit of about 20% compared to the "target" value, but at around 2000 rpm, the calculated acceleration is achieved quite well.
| Description: |
| VAGCOM: Speedometer, Accelerator, and More |
|
| File size: |
76.83 KB |
| Viewed: |
2232 times |
|
Gruß Ulf
_________
MG4 Electric
Translated on 08-10-2026, 23:36.
|
|
| Back to top |
Profile PM Garage |
|
Jan6K
Joined: 04/12/2002
Posts: 4741
Karma: +107 / -0
Location: Hagen
Premium Support
|
| 26-11-2004, 19:17 Subject: VAGCOM: Speedometer, Accelerator, and More |
Quote |
|
Hi,
I meant something slightly different... you're essentially trying to identify the sources of the disturbances with that method.
Here's how I would approach it: For each increase in speed (acceleration in rpm/s) that you calculate, determine the maximum and minimum values according to the method described above, and plot both of these. This will give you two curves, and the "true" value likely lies somewhere between them, which you should be able to identify relatively easily by visual inspection.
Best regards,
Jan.
1Z5 CFHF / AHB H4D
Translated on 08-10-2026, 23:38.
|
|
| Back to top |
Profile PM |
|
olbetec
Schrauber

Joined: 08/14/2002
Posts: 76
Karma: +4 / -0
Location: Garbsen bei Hannover
Support
|
| 27-11-2004, 0:20 Subject: Analyze Data: Insights & Best Practices |
Quote |
|
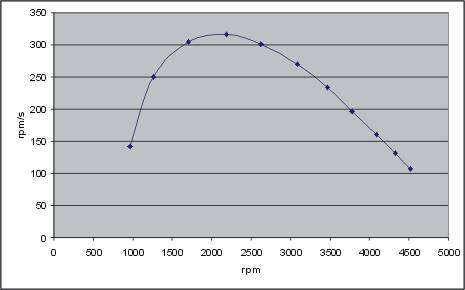
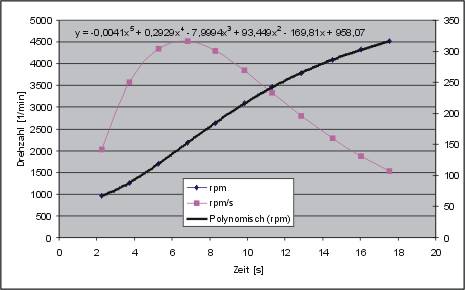
I would simply copy the RPM values and their corresponding timestamps into Excel. Then, I would fit a high-order curve to the data, display the function in the graph, and manually derive the interpolating function of the fitted curve. Finally, I would use the derivative to generate a new curve for a defined grid.
Cheerfully interpolated.
OlBe
P.S.: Tip: Please subtract a sufficiently large amount from the timestamps to bring the curve closer to the origin, otherwise the parameters of the fitted curve will become unusable large...
P.S.: And so, what's the point of all this when it comes to the major unknowns (vehicle weight and the corresponding reduced moments of inertia, drag curve, slip)? I once considered recording a coast-down curve, which would then only leave the reduced vehicle weight and the slip that's already accounted for in the acceleration data...
P.S.: The "standard" gear ratio was not used for the measurement setup (Fabia, 3rd gear)...
| Description: |
| VAGCOM: Speedometer, Accelerator, and More |
|
| File size: |
11.43 KB |
| Viewed: |
2171 times |
|
| Description: |
| VAGCOM: Speedometer, Accelerator, and More |
|
| File size: |
18.41 KB |
| Viewed: |
2265 times |
|
Fabia I TDI, EZ06/01 (1,9/74kW, ATD)
Octavia II TDI DSG EZ11/06 (2,0/103kW, BMM)
Translated on 08-10-2026, 23:40.
|
|
| Back to top |
Profile PM |
|
ulf
Profi-Schrauber
Joined: 04/13/2002
Posts: 11058
Karma: +18 / -0
Location: Saarland
2023 MG ZS
Premium Support
|
| 27-11-2004, 10:53 Subject: Data Analysis: Extract Insights & Improve Results |
Quote |
|
olbetec wrote: | | I would simply copy the RPM values at the corresponding timestamps directly into Excel. Then, I would fit a high-order curve to the data, display the function in the graph, and then manually derive the interpolating function of the fitted curve. Using the derivative, I would then generate a new curve for a grid... |
*kopfrauch -> kapitulier* - now it's finally catching up to me (again) that I didn't study this, and my advanced math class was over 20 years ago.
Quote: | | P.S.: And what good does that do you when it comes to the large unknowns... |
Once the DZR simulation (which takes all these factors into account) has been adjusted to reflect real-world conditions, it should, when combined with the "target torques," provide reasonably realistic rpm-time curves for the speed drop phenomenon.
And with this simulation, I want to compare the actual values.
My "partially de-noised" curves already confirm the tendency of the dynamometer's impression: the low-end performance is significantly less than what the motor's paper curve suggests. . .  Gruß Ulf
_________
MG4 Electric
Translated on 08-10-2026, 23:42.
|
|
| Back to top |
Profile PM Garage |
|
olbetec
Schrauber
Joined: 08/14/2002
Posts: 76
Karma: +4 / -0
Location: Garbsen bei Hannover
Support
|
| 27-11-2004, 20:05 Subject: Derivatives: Understanding and Calculation |
Quote |
|
Okay, here it is again, for you to write down:
The function of the trend line is now displayed in the graph. Refer to the Excel help documentation for instructions on how to do this.
Here's how the derivation works:
y(x) = rpm(x) = ax^5 + bx^4 + ... + ex + f. x represents time.
y'(x) = d rpm / dx = 5 * a * x^4 + 4 * b * x^3 + 3 * c * x^2 + 2 * d * x + e, where a through e are the coefficients from the curve fitting function, and 'f' is omitted. (Curve analysis: This is something you also learn in secondary school...)
Now, write the formula behind the speed values, copy it down to the last value, and create a new graph with d rpm / dx (which is rpm/s over time), along with the corresponding speed values, and you'll have your desired analysis.
Sure, here's the translation:
"I'm going to review some basic elementary school math concepts."
OlBe
P.S.: Don't underestimate the DZR (German Data Protection Register): the values it provides are only qualitative, never absolute!!! The adjustments are also based on fabricated paper values...
Fabia I TDI, EZ06/01 (1,9/74kW, ATD)
Octavia II TDI DSG EZ11/06 (2,0/103kW, BMM)
Translated on 08-10-2026, 23:45.
|
|
| Back to top |
Profile PM |
|
ulf
Profi-Schrauber
Joined: 04/13/2002
Posts: 11058
Karma: +18 / -0
Location: Saarland
2023 MG ZS
Premium Support
|
| 28-11-2004, 0:39 Subject: Derivatives: Learn & Calculate Easily |
Quote |
|
olbetec wrote: | The function of the trend line is now displayed in the graph. To find out how to do this, refer to the Excel help documentation.
The derivation now proceeds as follows . . . |
I started by simply making myself comfortable and displaying a trend line that appeared plausible for the first "random zigzag" sequence.
In the low RPM range, it already gives a pretty good impression of what the "pop-o-meter" would indicate.
So, in any case, thank you for the tip about the trend line  .
| Description: |
| VAGCOM: Speedometer, Accelerator, and More |
|
| File size: |
81.99 KB |
| Viewed: |
2019 times |
|
Gruß Ulf
_________
MG4 Electric
Translated on 08-10-2026, 23:48.
|
|
| Back to top |
Profile PM Garage |
|
olbetec
Schrauber
Joined: 08/14/2002
Posts: 76
Karma: +4 / -0
Location: Garbsen bei Hannover
Support
|
| 29-11-2004, 9:16 Subject: DIY Fails: Hilarious Home Improvement Mistakes |
Quote |
|
I still believe the error in your makeshift calibration is so large that it's impossible to make any statements about power/torque dips in the low RPM range.
You could send me your log files sometime, and I can provide you with a more accurate curve.
Carelessly assembled.
OlBe.
Fabia I TDI, EZ06/01 (1,9/74kW, ATD)
Octavia II TDI DSG EZ11/06 (2,0/103kW, BMM)
Translated on 08-10-2026, 23:49.
|
|
| Back to top |
Profile PM |
|
|


 Bookmarks
 Links
 Garage
 FAQ, Legal Notice & Privacy
 RSS Feed
 Register
 Login

